You know your premium to the dollar. Your real return is a guess.
Premium lands in your account and feels like profit. Then the call caps a rally, or the put ties up six figures for a month, and the honest math gets blurry. OMM keeps two numbers clean: ROCAR, the return each option earns on the capital it puts at risk, and your time-weighted total return with dividends and price gains included, charted against the S&P 500.
Premium collected is a vanity metric.
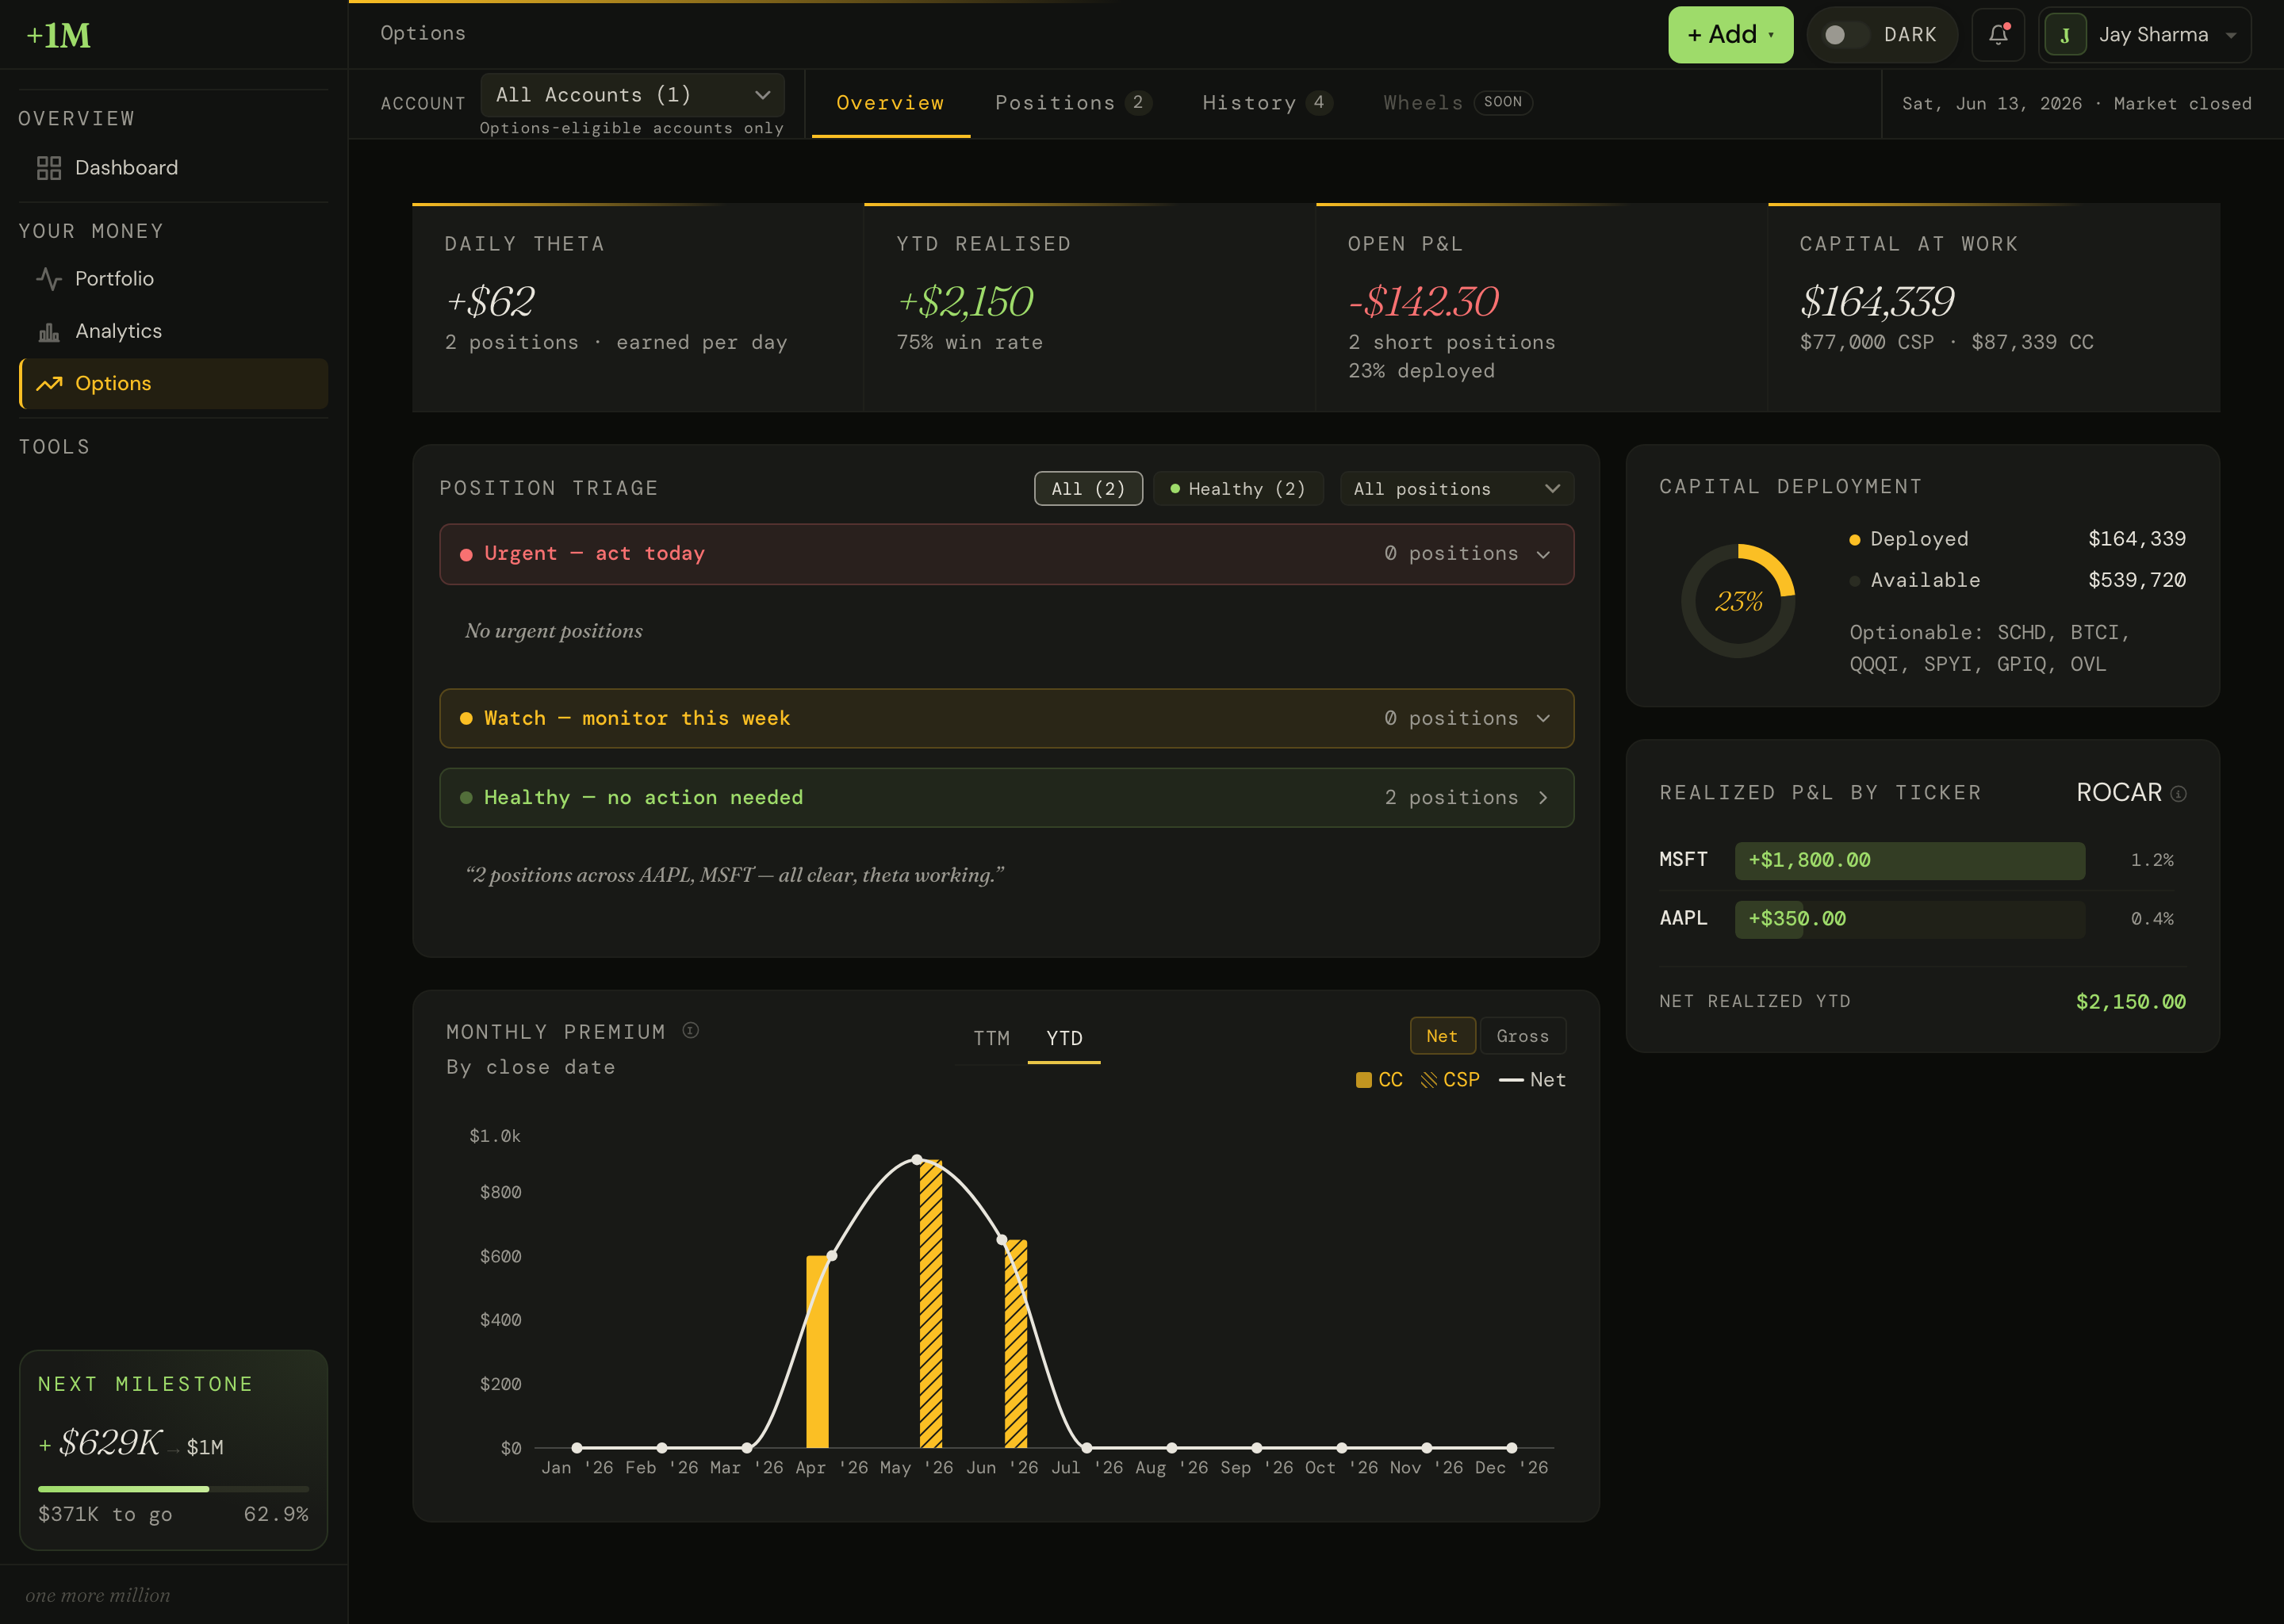
Sell a covered call and you cap your upside. Sell a cash-secured put and you lock up cash that could be working anywhere else. Your broker records the premium and ignores both costs. OMM measures ROCAR, return on capital at risk, on your options: what the trade earned, divided by what it tied up, the cash behind the put or the cost basis behind the call, net of fees. If your target is 2% a month on risk, ROCAR tells you whether this month cleared it. Premium collected never will.
A forty-contract book should take minutes to check. OMM sorts every position into Urgent, Watch, or Healthy, so you open the app and handle the five that need you today instead of scrolling all forty for the one near assignment. Roll Scout flags the contracts worth rolling before expiry forces your hand, with the math already worked. You manage by exception. The app does the watching.
The dividend tracker that can see your options.
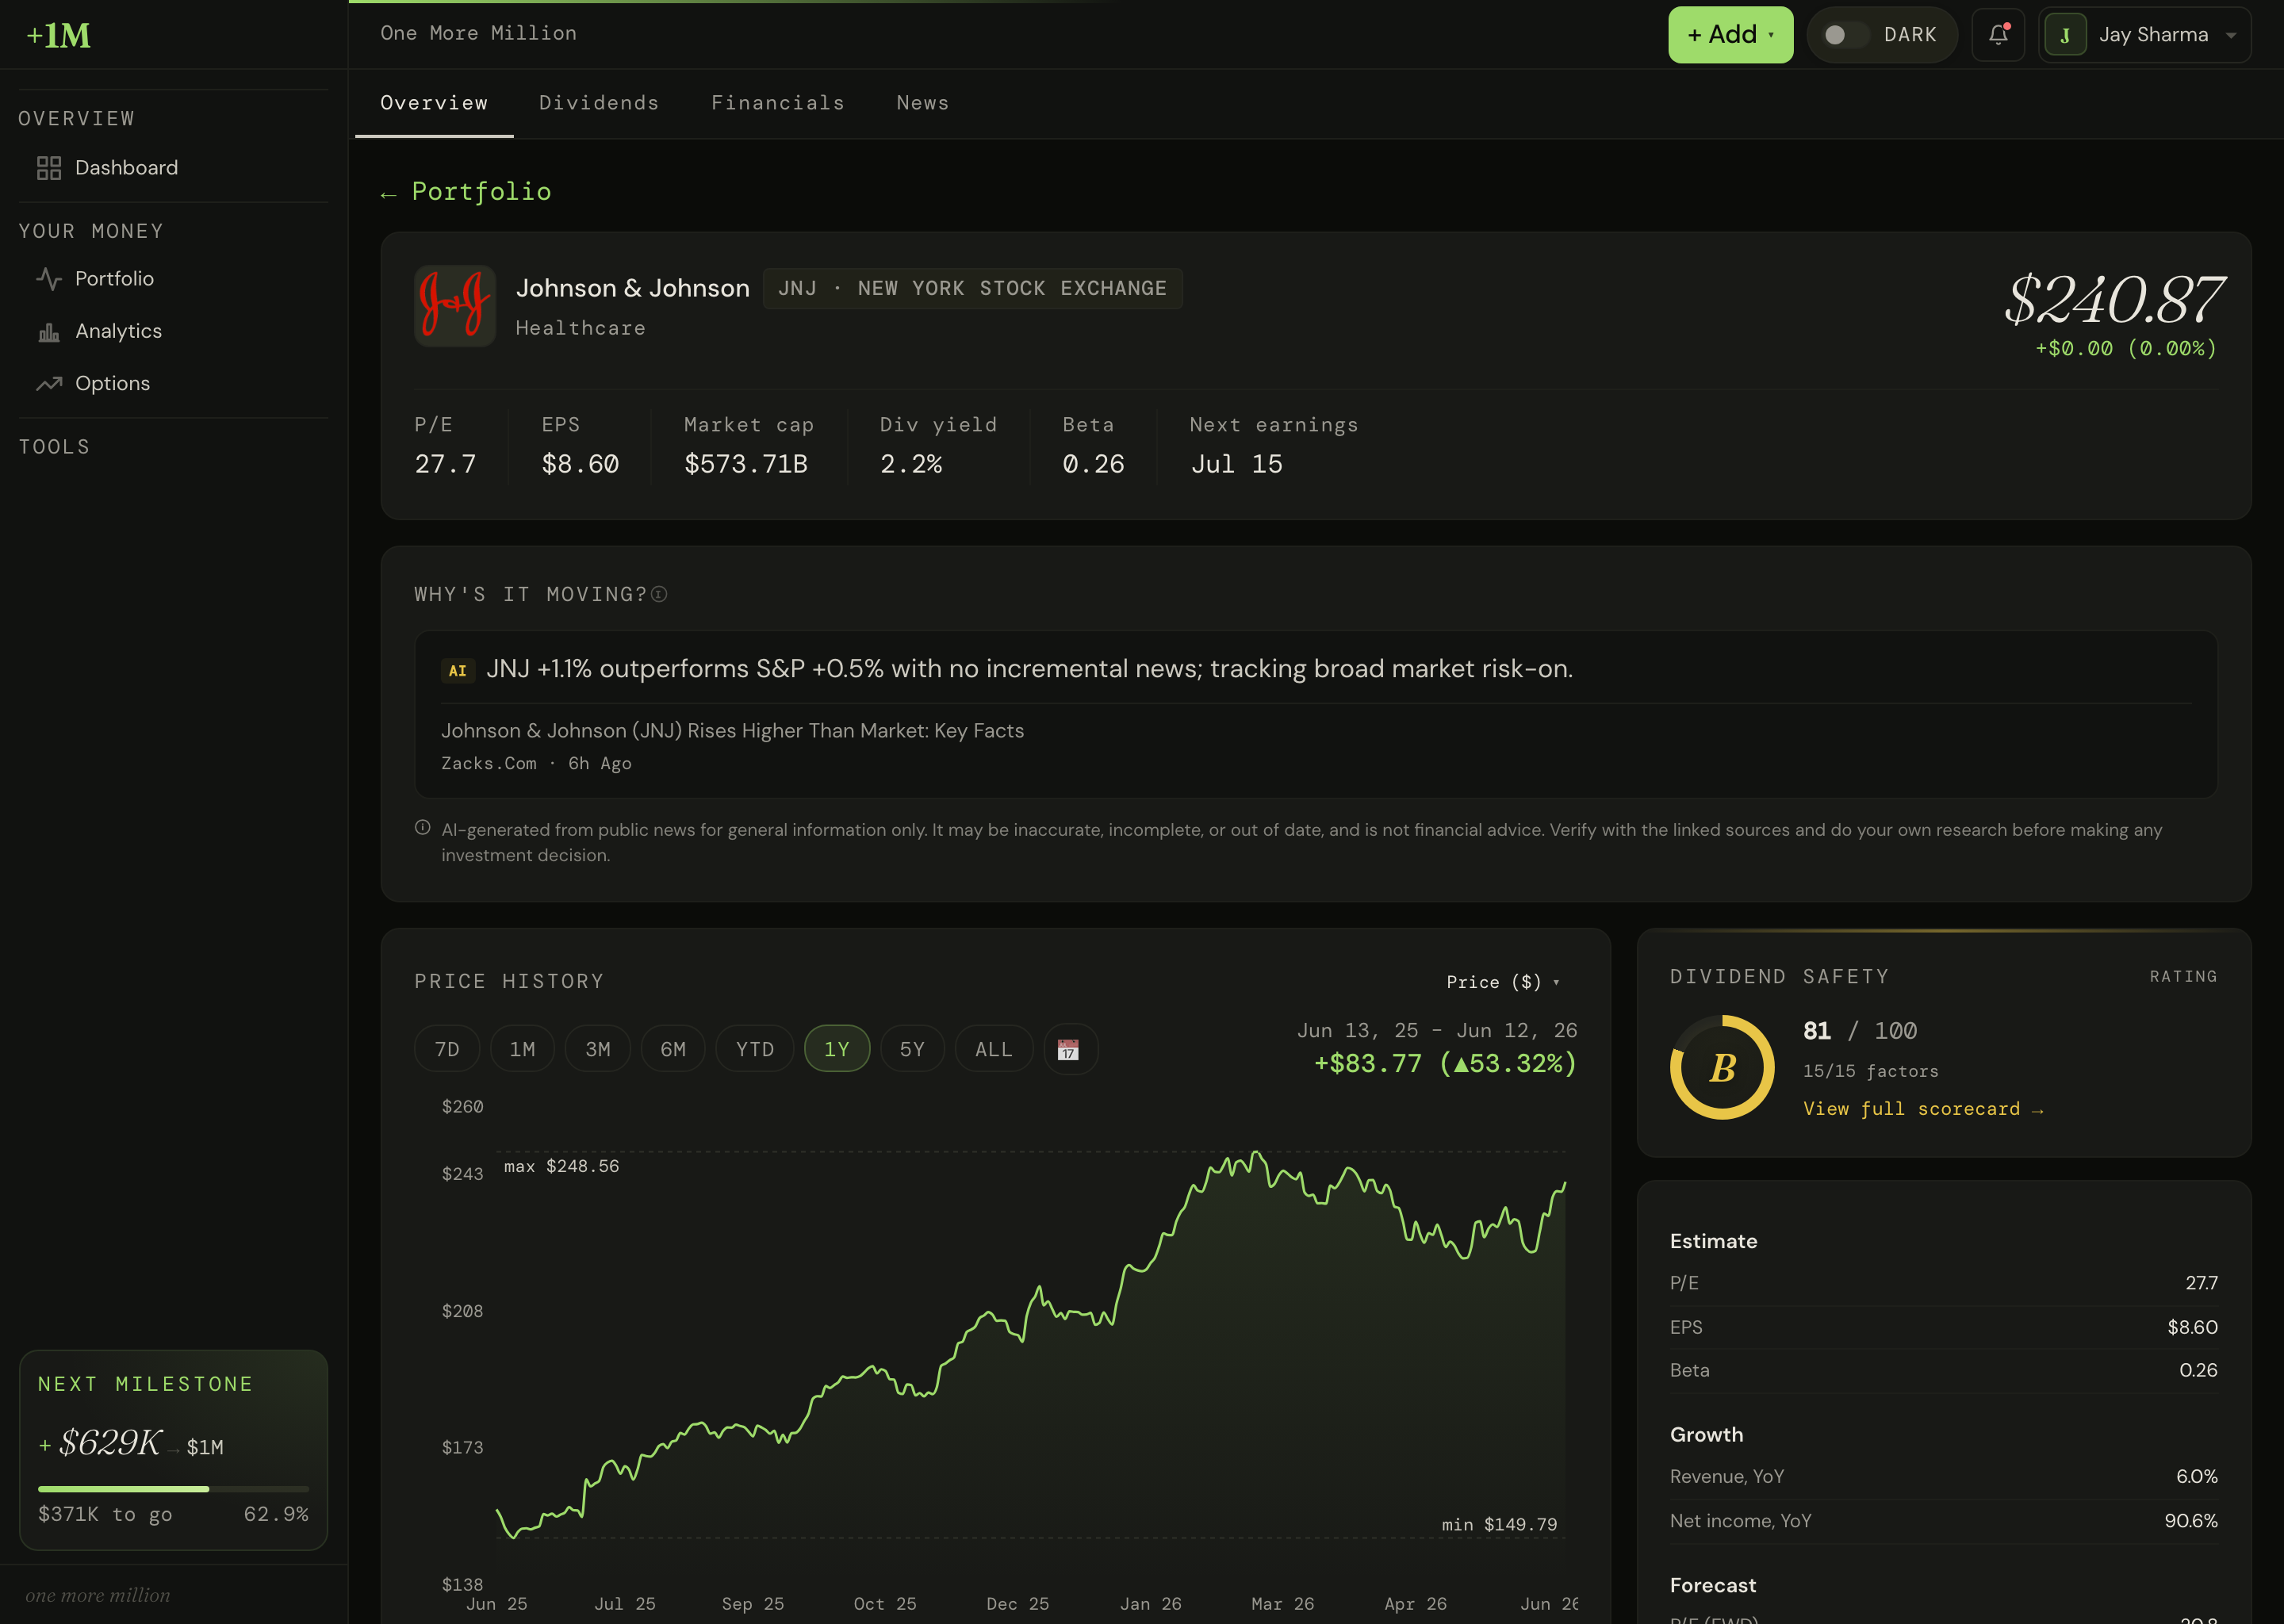
Most dividend apps stop at the payouts. OMM sets them beside your option premium, because for an income investor they are one paycheck from two sources. Track every payment, see the year ahead by ex-date, and read a safety rating on each holding: a 0 to 100 score with a letter grade, built from payout ratio, coverage, and growth history. JNJ scores 81 on a 59.5% payout ratio and five straight years of dividend growth. A stretched payout scores low while you still have time to act.
The number your broker gets wrong.
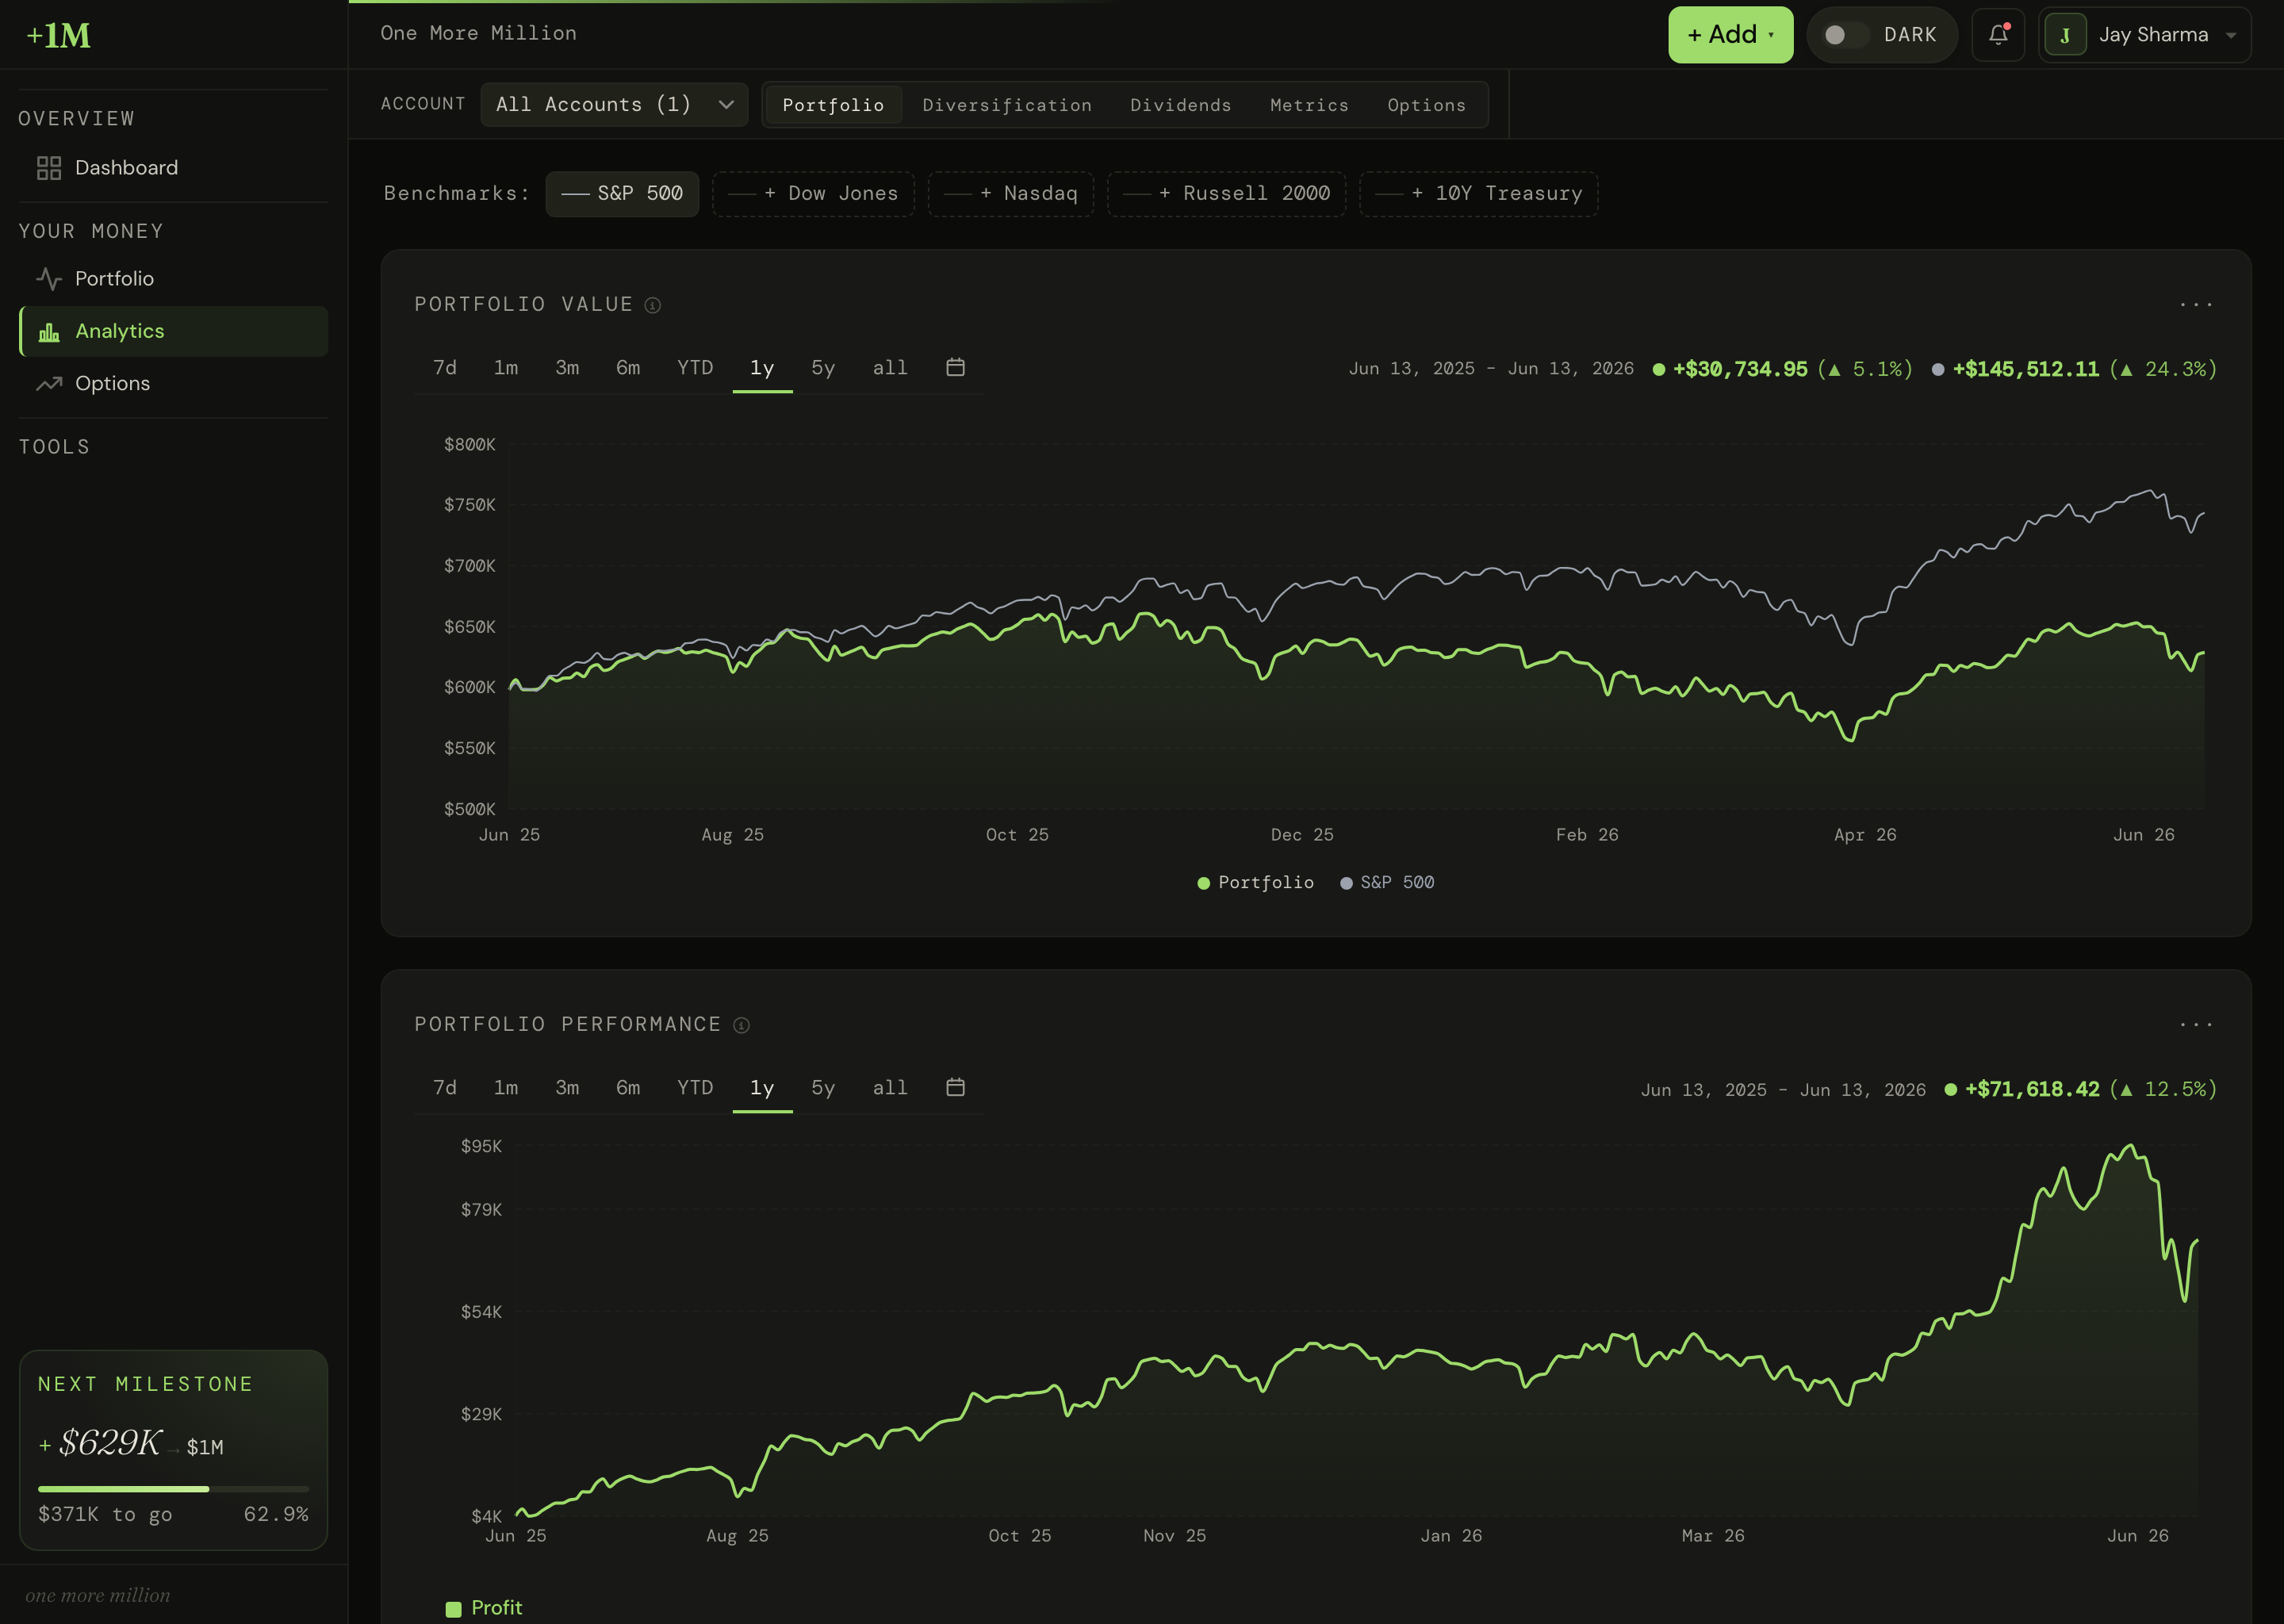
Your broker charts price change and calls it performance. Dividends go missing. Deposits distort the line. OMM computes a true time-weighted return, the method funds use to report, so a $50,000 deposit in March neither flatters nor punishes the result. Dividends and price gains fold in, and the whole thing sits on one chart against the S&P 500. Your options income stays beside it, measured by ROCAR, because a covered call and an index fund deserve different yardsticks. Two honest numbers cover everything you own.
Three trackers can’t answer one question.
Dividends, option premium, and price gains behave like one income system. OMM measures them like one.
The dividend apps can’t see your options. The wheel trackers can’t see your portfolio. Your broker sees everything and still leads with the vanity number. Every tool guards its own lane, and your real income lives in the gap between them. OMM was built for that gap. Dividends and price gains resolve into one honest total return, options get measured by what they earn on the capital at risk, and the whole book reads in a minute. Stop stitching three dashboards into a guess.
Every dollar this book earns is a dollar you didn’t have to.
Two minutes inside the real app.
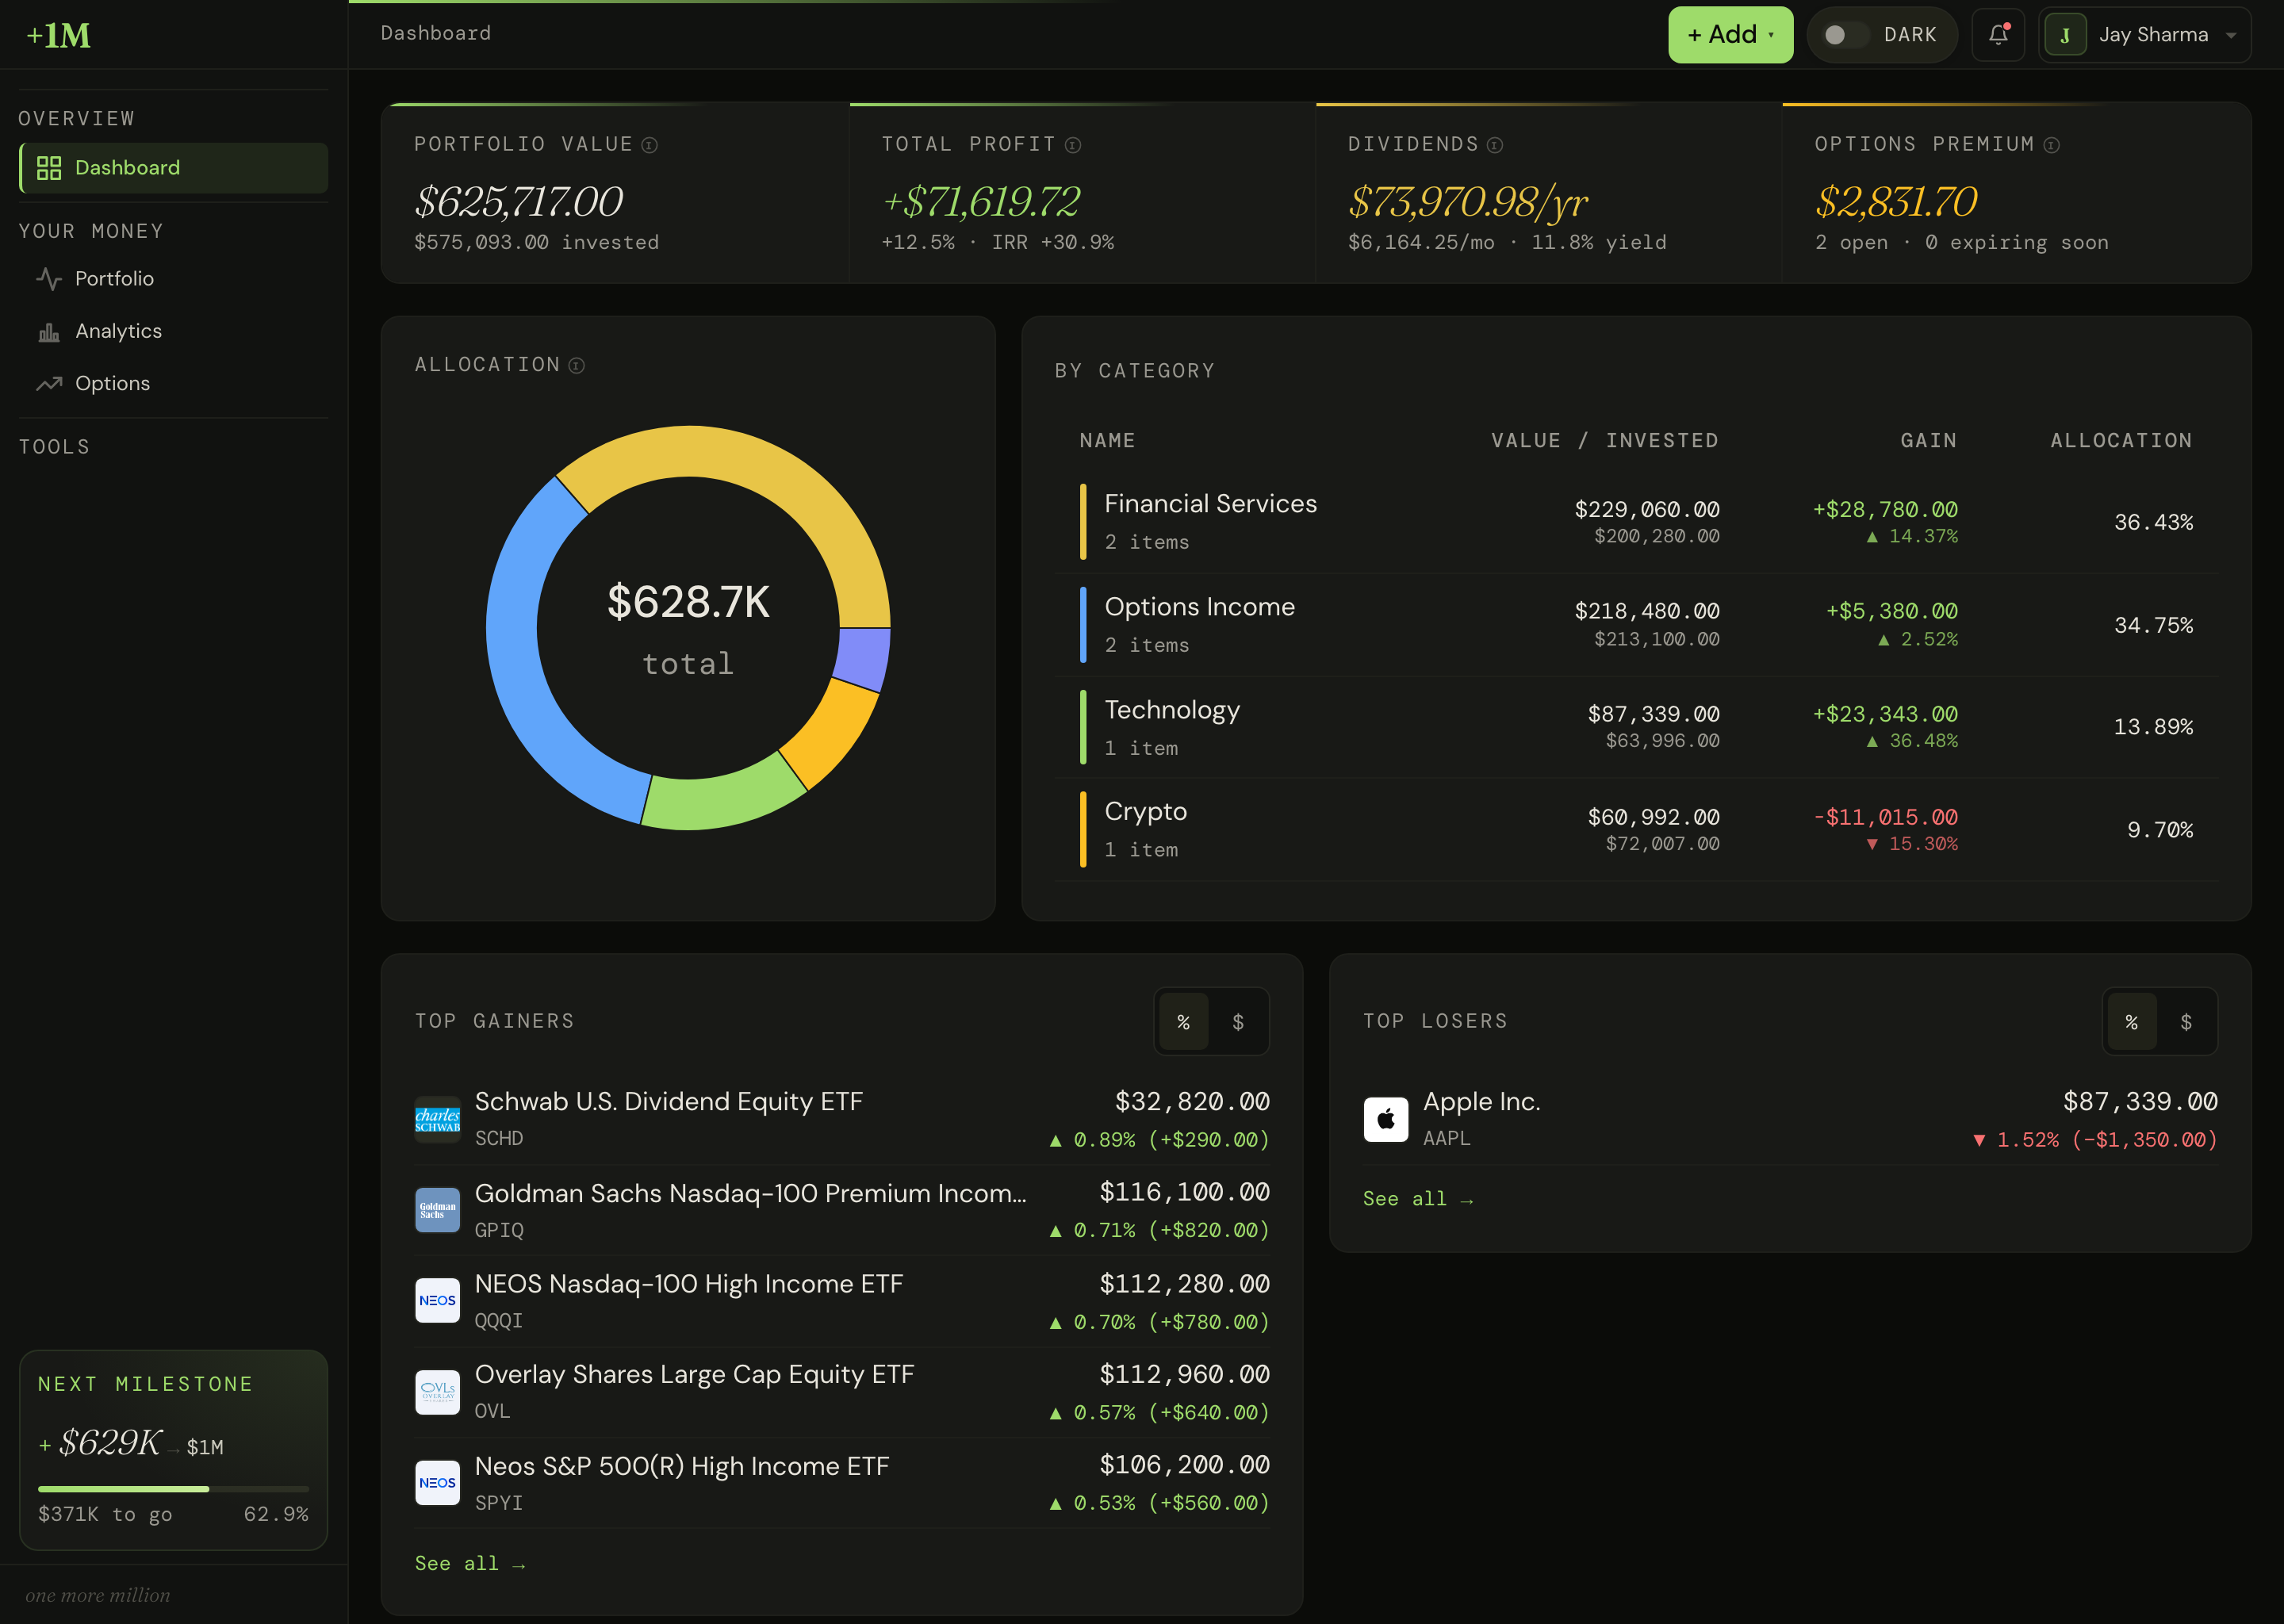
This is the shipped product running on a real account. Every number in the frame is live data.
Set up once. Read it daily.
Enter your accounts, holdings, and options yourself. No broker login, nothing to connect, nothing to leak. Free covers 10 holdings and 5 options positions.
Live prices on every position. Dividends mapped by ex-date, a year ahead. Options followed through every roll, expiry, and assignment, with cost basis adjusted at each step.
ROCAR on your options, total return on the whole book against the S&P 500. Triage tells you which positions need you today. Most days, none do.
Built for the people running the book.
You run the wheel. Covered calls, cash-secured puts, the occasional defensive roll. You already suspect premium collected overstates your month. OMM settles it position by position: real P&L and ROCAR on every contract, triage on the whole book, and a flag on the rolls before expiry decides for you. The spreadsheet you’ve been hand-feeding since 2021 is done.
You live on the payouts, or you plan to. The income has to grow and it has to hold. OMM logs every payment, maps the year by ex-date, and grades each holding’s safety, so a stretched payout shows up in the score while you can still do something about it. And when you write calls against your dividend names, that premium lands in the same ledger.
Retirement is years out, and what you want now is proof of progress. OMM tracks forward dividend income, options premium, and time-weighted total return on the whole book, quarter after quarter. When you ask whether you’re actually ahead of the index, the answer is a number on a chart.
The business model is the security model.
You add positions yourself. We never ask for your broker login, so there is nothing to hand over and nothing to leak.
Subscriptions are the entire business. Your data has exactly one job here: showing you your own numbers.
From billing settings, any day, without emailing anyone. The trial takes no card, so nothing charges until you choose to pay.
Export any account to CSV today, with one-click full export on the roadmap. Ask us to delete everything and we will. It’s your book.
I built this because I needed it.
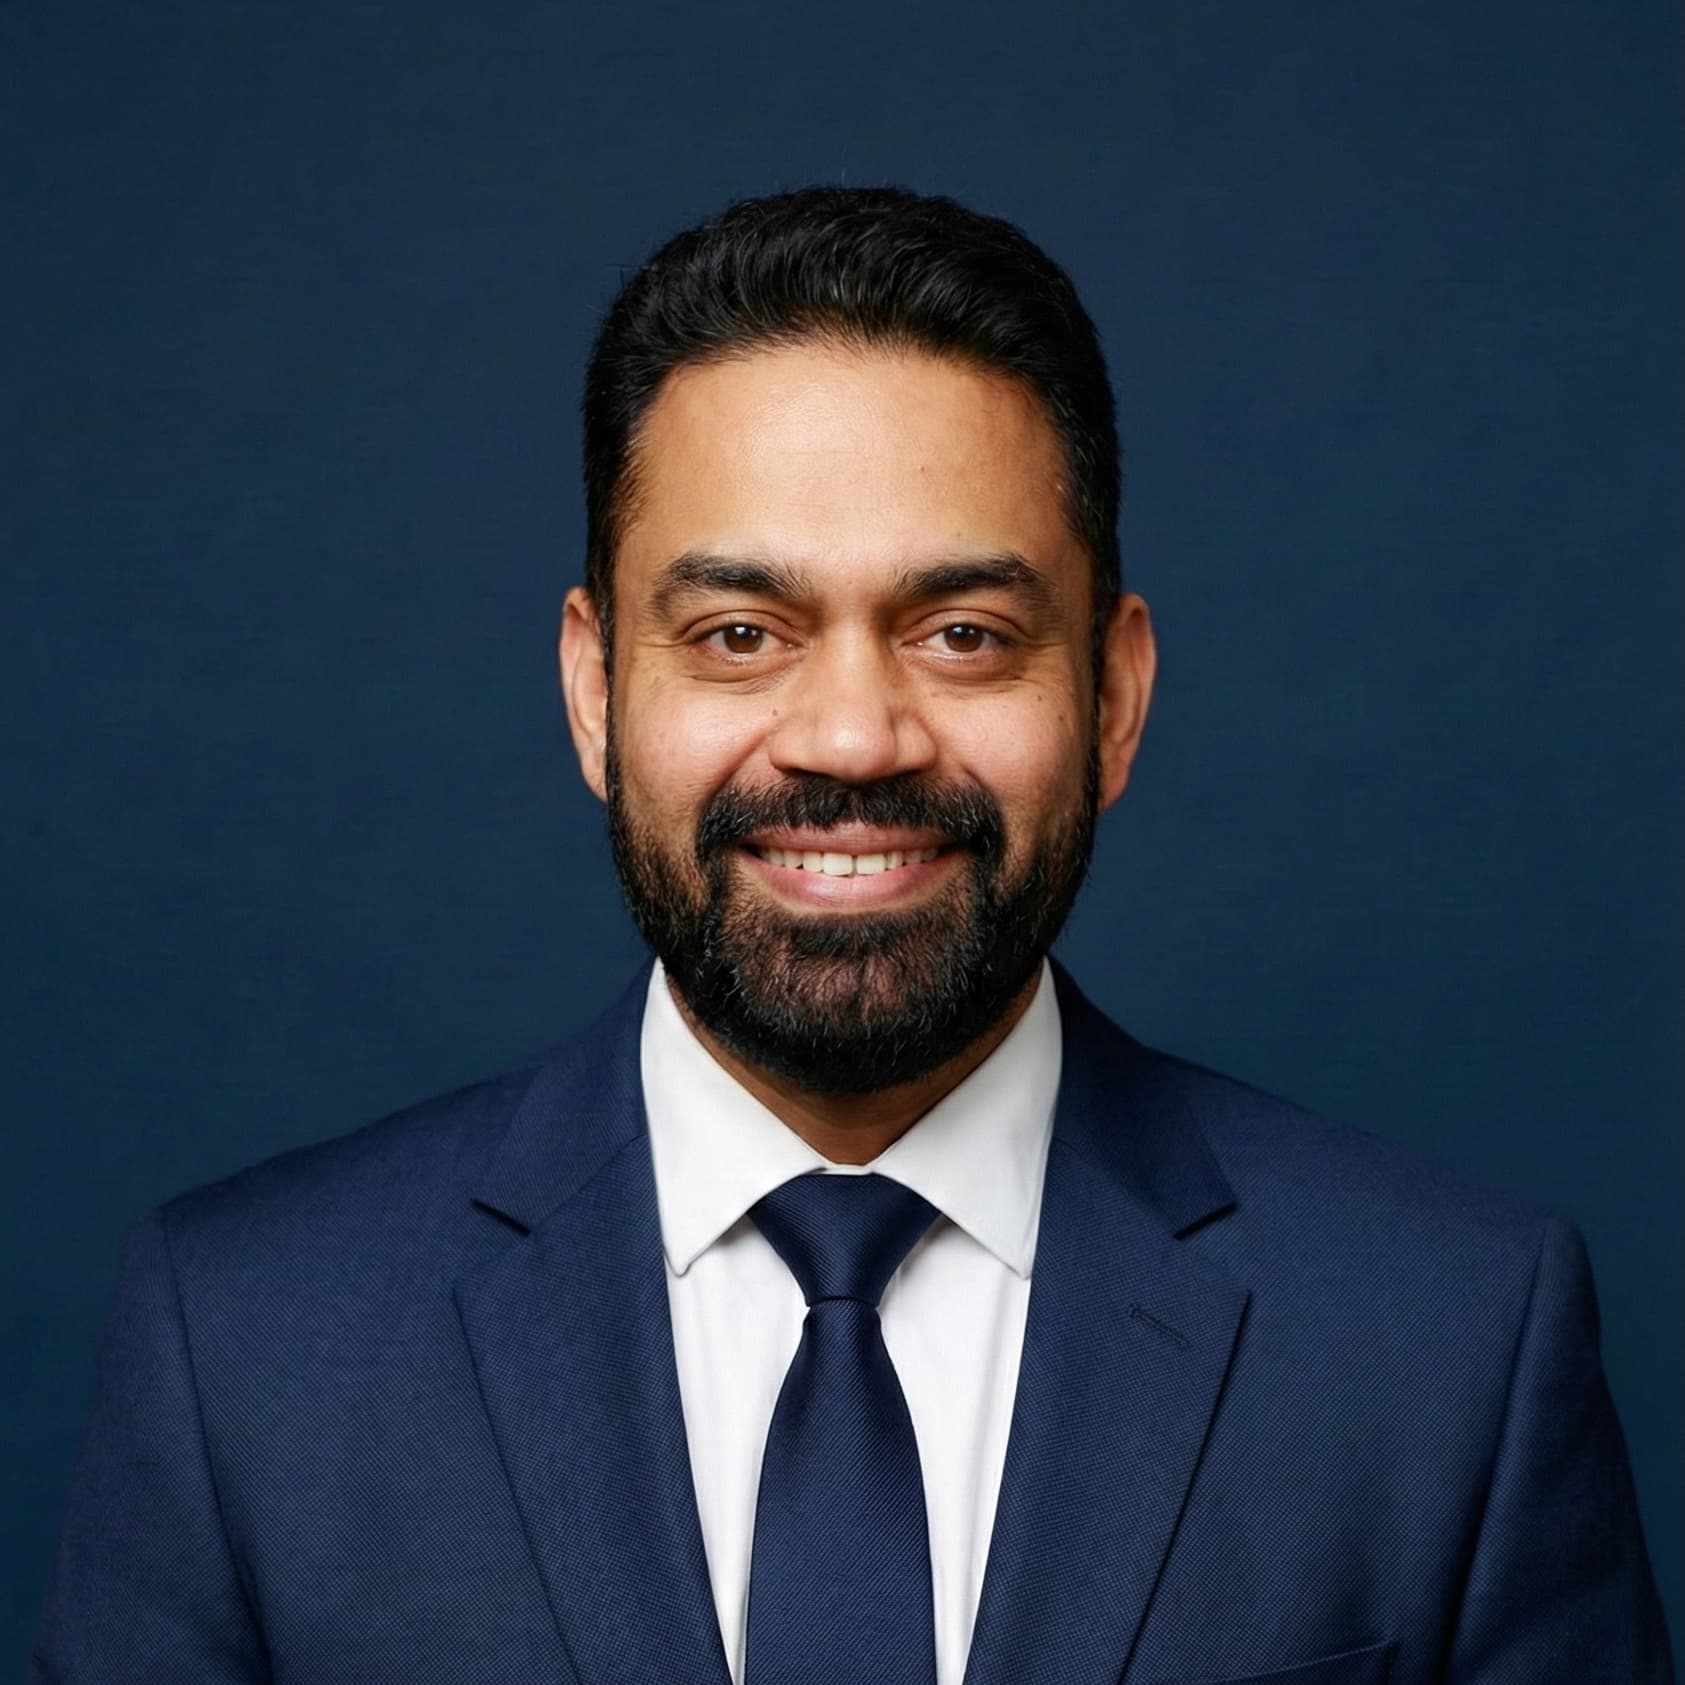
I’m Jay Sharma. I run a seven-figure book: dividend growers, a core of index funds, covered calls and cash-secured puts for income. For years I measured it across three screens that each told me half the truth. The broker flattered me with premium collected. The dividend app couldn’t see my options. The spreadsheet held everything and slowly became a Sunday-night job. After all that reconciling I still couldn’t answer the only question that mattered. Across the whole book, net of fees and capped gains, what am I actually earning?
No tool would tell me, so I built the one that does. Every screenshot on this page is my own account in OMM, live numbers included. It’s the honest view of a real income book, built by the person who has to trust it.
Frequently asked
Is this just another dividend tracker with options bolted on?
How is this different from my broker's dashboard?
I already have a spreadsheet. Why switch?
Do you connect to my brokerage?
Is my data safe?
What does the free plan include? Is there a trial?
Is this a trading platform?
Count what you have. Then go get one more million.
The free plan handles a real starter book, up to 10 holdings and 5 options positions, with dividend tracking and honest total return. No card, no clock.
Start free, no card neededNo ads. No data selling. Cancel anytime.
Not ready to sign up?
Run it next to your broker first. The free plan covers 1 account, 10 holdings, and 5 options positions, enough to watch a month of dividends and premium land and see what your statements leave out. It doesn’t expire.
Start free, no card needed